Visual management: keep your team on track

Since the beginning of civilizations, people have always used images to explain things, to simplify and reduce the content to the necessary and important aspects. From the Cro-Magnon men who drew their life moments on the walls of their caves, to the Egyptians who traced hieroglyphics on papyrus rolls, writing as we know it today, composed of an alphabet, was not the first means of information transmission (apart from speech).
Hundreds of years later, this principle has not changed. We like to transmit information visually because it forces us to focus on the most important points.
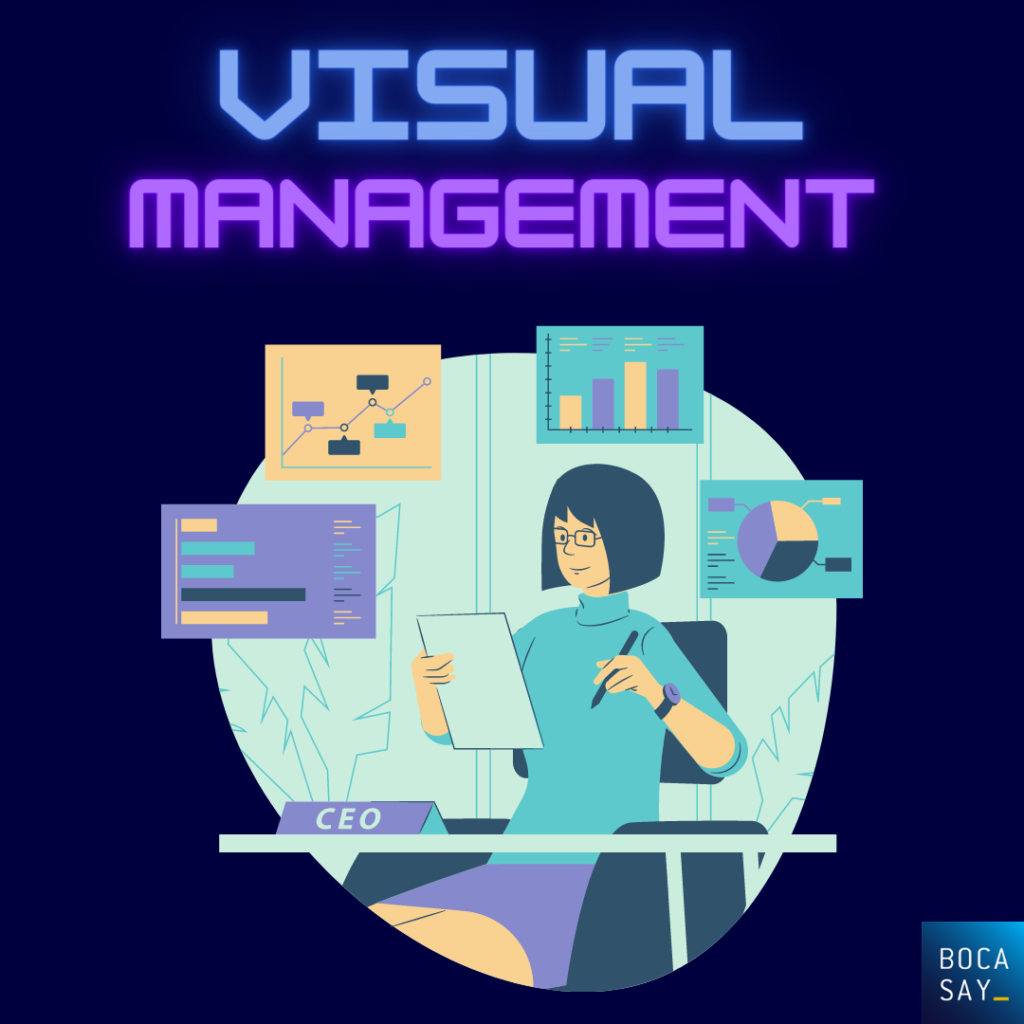
What is visual management?
We have all heard the saying “a picture is worth a thousand words”. This is the best way to summarize visual management. The objective is to facilitate access and understanding of information. The principle of visualization also facilitates work.
Visual management is a way to visually communicate expectations, performance, standards or warnings, in a way that requires little or no prior training to interpret. You may have heard the term in the context of the workplace, particularly in factories, but it is actually used in all sorts of everyday scenarios. You’ve probably used dozens of visual management tools today without giving it a second thought.
𝔸𝕤 𝕒 𝕤𝕠𝕗𝕥𝕨𝕒𝕣𝕖 𝕕𝕖𝕧𝕖𝕝𝕠𝕡𝕞𝕖𝕟𝕥 𝕔𝕠𝕞𝕡𝕒𝕟𝕪, 𝕠𝕦𝕣 𝕥𝕖𝕒𝕞𝕤 𝕒𝕣𝕠𝕦𝕟𝕕 𝕥𝕙𝕖 𝕨𝕠𝕣𝕝𝕕 𝕒𝕣𝕖 𝕦𝕤𝕖𝕕 𝕥𝕠 𝕦𝕤𝕚𝕟𝕘 𝕧𝕚𝕤𝕦𝕒𝕝 𝕔𝕠𝕞𝕞𝕦𝕟𝕚𝕔𝕒𝕥𝕚𝕠𝕟 𝕞𝕖𝕥𝕙𝕠𝕕𝕤 𝕥𝕠 𝕔𝕠𝕝𝕝𝕒𝕓𝕠𝕣𝕒𝕥𝕖 𝕠𝕟 𝕕𝕖𝕧𝕖𝕝𝕠𝕡𝕞𝕖𝕟𝕥 𝕡𝕣𝕠𝕛𝕖𝕔𝕥𝕤.
Why use visual management?
If visual management is used correctly, it should present information in a way that is quick and easy to understand. It should be easy to tell if performance is good or bad in five seconds. It is common to see red and green colors to signify that goals are being met or not, or up or down arrows.
Another example of visual management that makes information easy to understand quickly is a work/expectation board. This visual shows the team what they are working on and what is coming up. They can also easily see the items they have completed. With clear information accessible to the team, this can even eliminate some regular meetings.
In general, visual management has many advantages:
- It allows you to keep the objective in mind and to adjust the parameters according to the daily evolution of the project. Indeed, this monitoring of the project progress allows you to validate the steps one after the other, and to make sure that the objective is always in the line of sight.
- It helps avoid mistakes that can cost time and money. When you have visual feedback, it becomes more obvious where you can improve or change, much more so than with numbers or overly technical data.
- It helps reduce misinterpretations and communication breakdowns. Being available to all team members, the same simple information is communicated equally and with a much reduced risk of misunderstanding.
- It encourages team member involvement. Each member feels involved in the evolution of the project and can directly see the impact of their work on its outcome. This form of validation gives value and meaning to the participants.
- It allows us to know the progress of the project in real time and facilitates organization. Knowing exactly where we are and what the next steps are, the organization is only made more fluid and easier.
- It allows you to control the progress of the project. The visualization of the project in progress allows us to better understand it and tame it. Only when you have all the necessary information, then you can be committed, efficient and confident.
According to studies conducted by the Wharton School of Business, using visual management can help you shorten the time spent in meetings by 24%, and speed up your decision making by 64%.
The different visual management tools
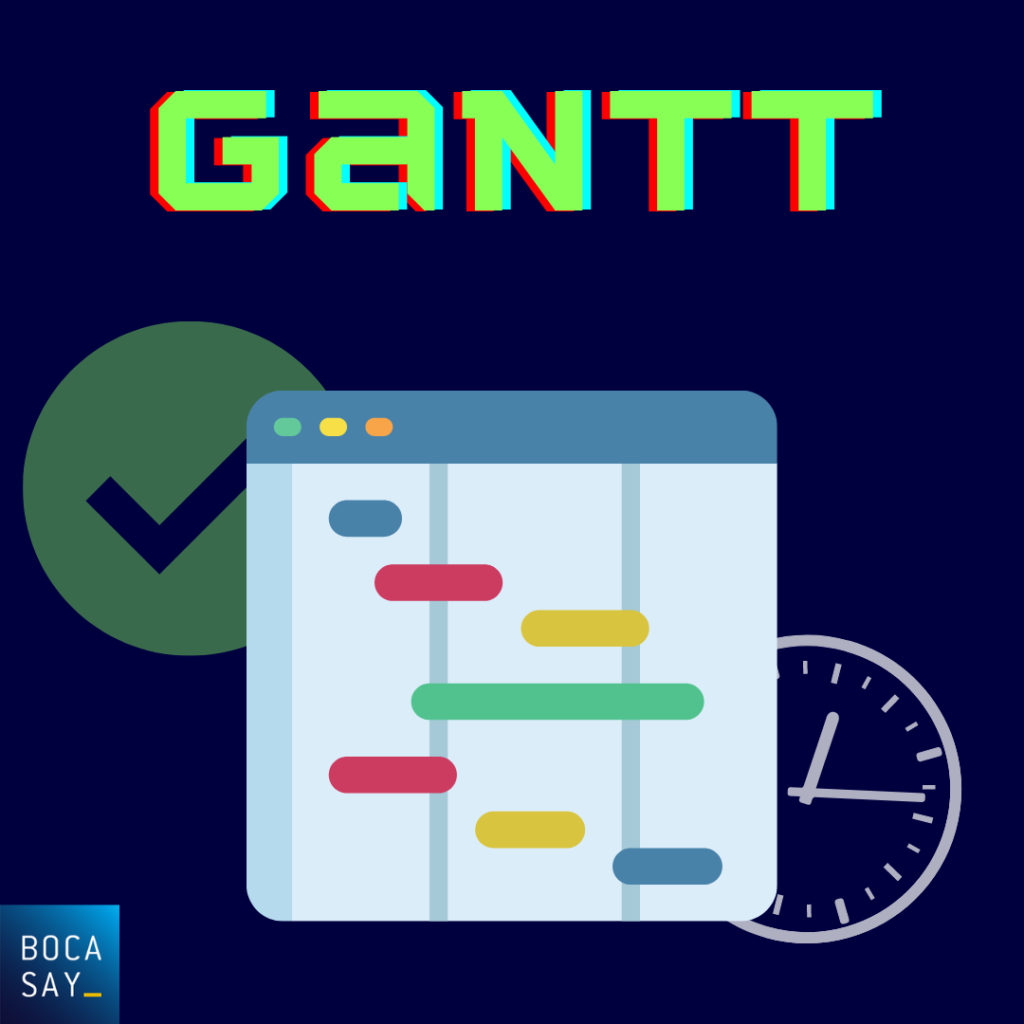
The most common form of visual project management is the Gantt chart. It is one of the most effective tools for visually representing the progress of the different steps that make up a project.
The left-hand column of the chart lists all the tasks to be completed, while the header line represents the most appropriate time units for the project (days, weeks, months, etc.).
Each task is materialized by a horizontal bar, whose position and length represent the start date, the duration and the end date.
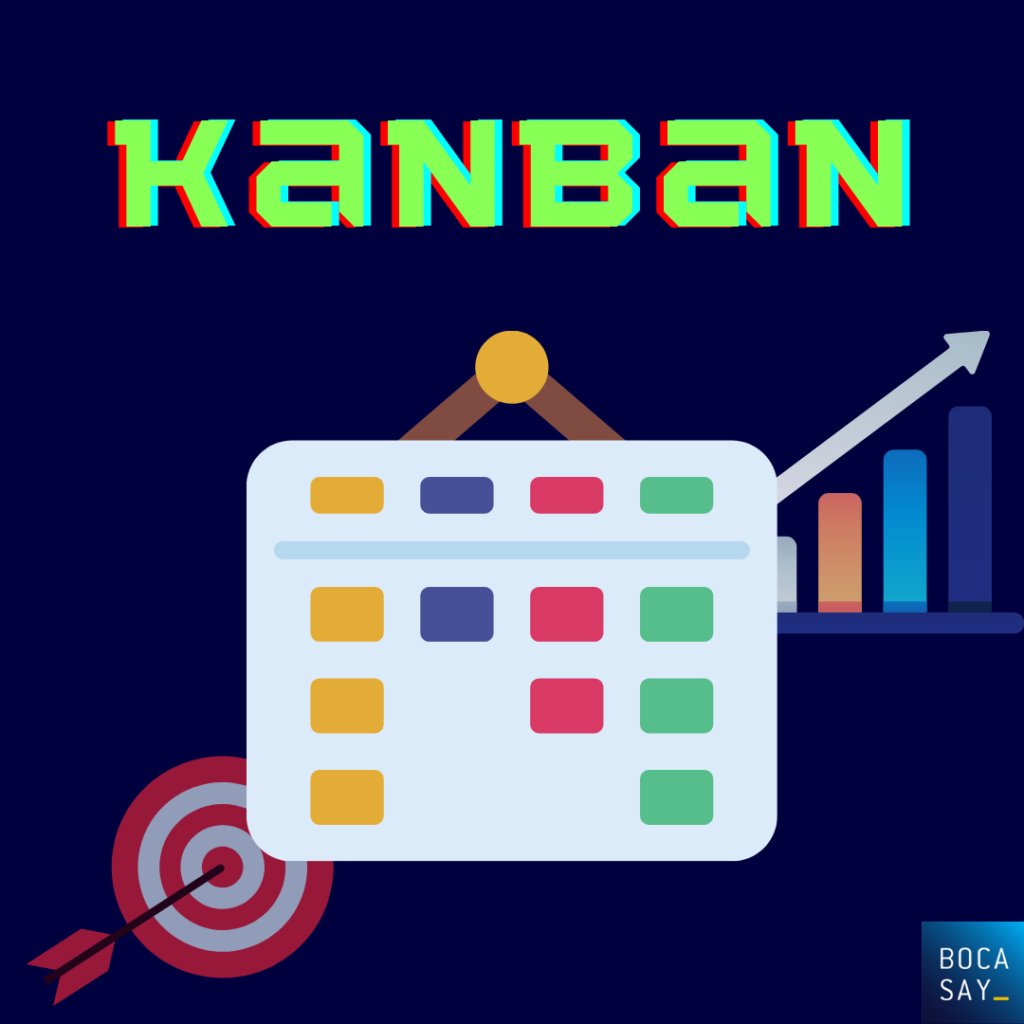
Kanban boards use cards to visualize the evolution of work units in a production process. A kanban board is typically divided into four sections: “to do,” “in progress,” “to test,” and “completed.” Employees move each card from one section of the board to another to represent the evolution of the item in the project.
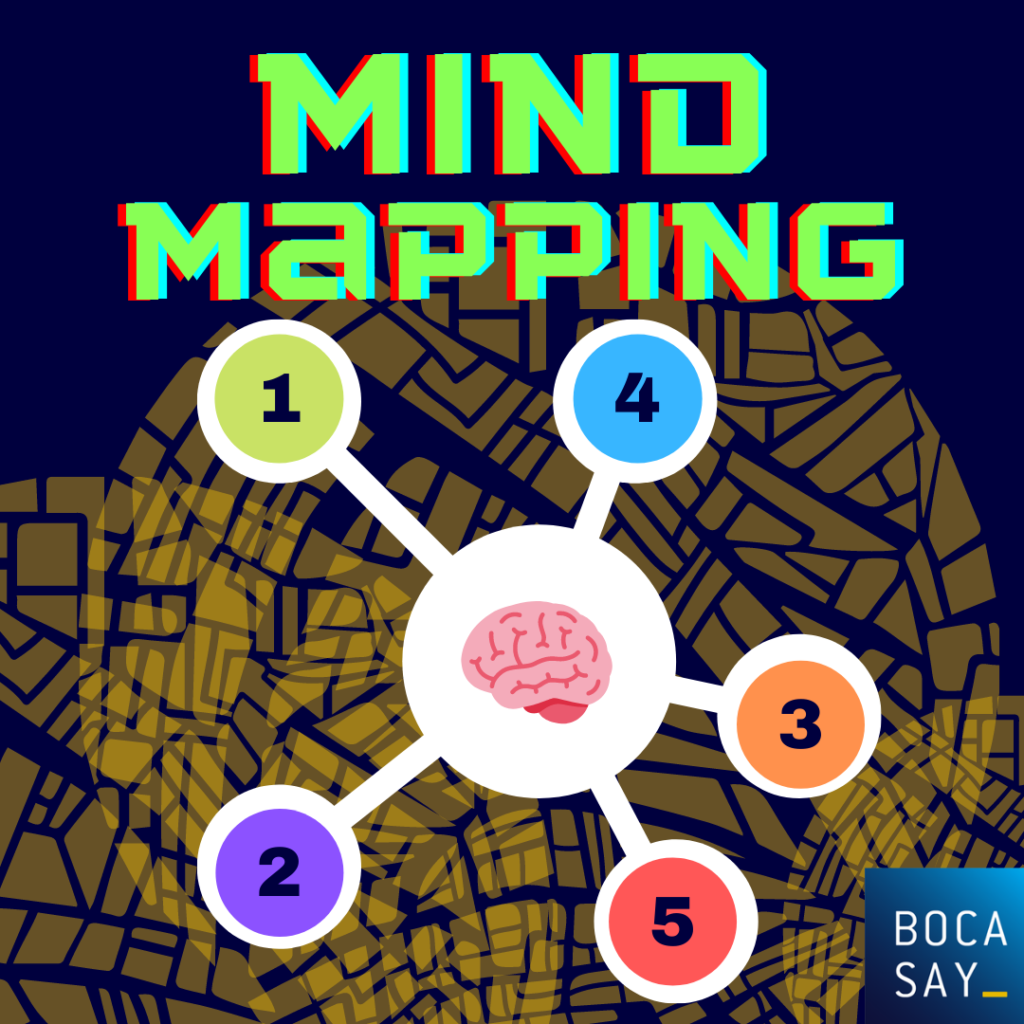
Mind mapping is a graphical way to represent ideas and concepts. It is a visual thinking tool that allows you to structure information, helping you to better analyze, understand, synthesize, remember and generate new ideas. As opposed to traditional note-taking or linear text, the information is structured in a way that is much more like the way your brain works. Because it is both an analytical and artistic activity, it engages your brain in a much richer way, enhancing all its cognitive functions.
No matter which method you choose for your business, in order to maximize the effectiveness of your visual management, make it aesthetically pleasing. The more pleasant and useful you make your tool, the more it will be used. There are several software programs dedicated to visual management that are ready to be used. Examples include Iobeya, Sesa systems, Signos and Ubikey.
If you work in technology, your work is often invisible and intangible. Visual management tools help you make your work visible so you can show it to others and keep everyone in sync.